UBS, a global firm providing financial services, previously worked with Deloitte Design on an IOS app for their Wealth Management services. The project was a success and UBS returned to Deloitte to re-design the wealth management portal using the app as a template.
The Wealth Management portal serves as an entry point for UBS's most valued customers. Users can manage their banking needs there or connect with their Financial Advisor. The target audience is emerging affluent and high-net-worth users with multiple investable assets.
Re-think the customer experience
While the visual design of the app would guide the re-design, the functionality of the main responsive site would require a more robust interface. The customer experience needed to be re-thought.
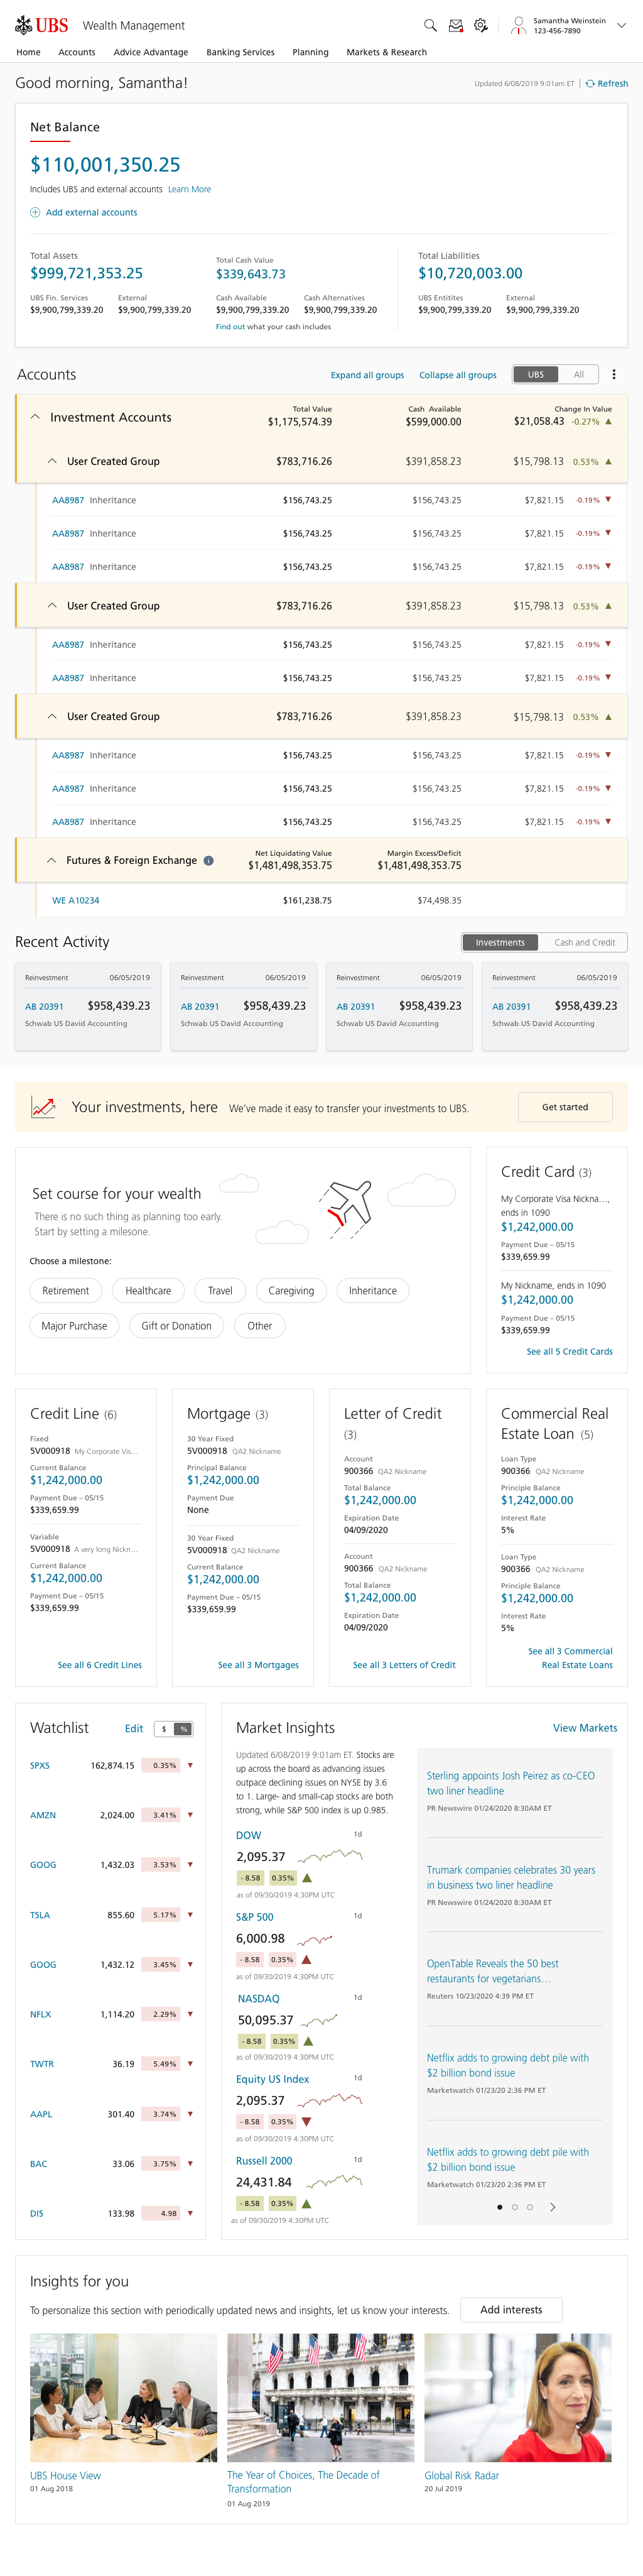
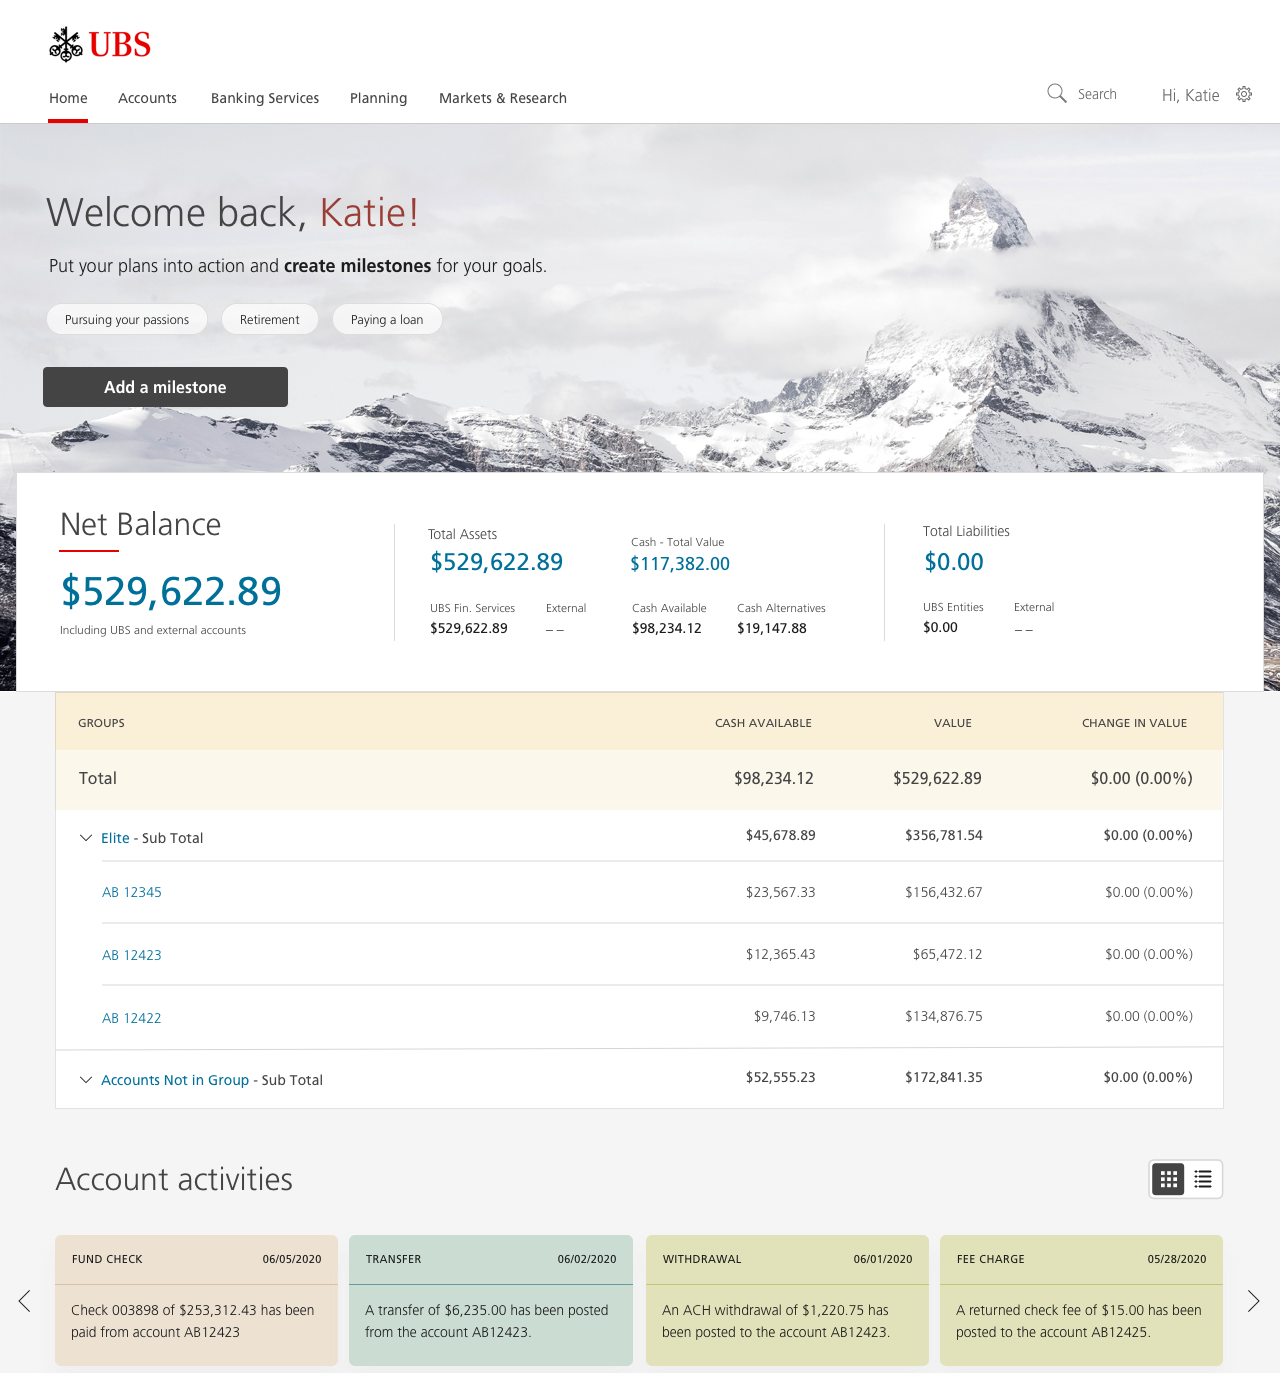
A personalized and holistic view of clients' total wealth.
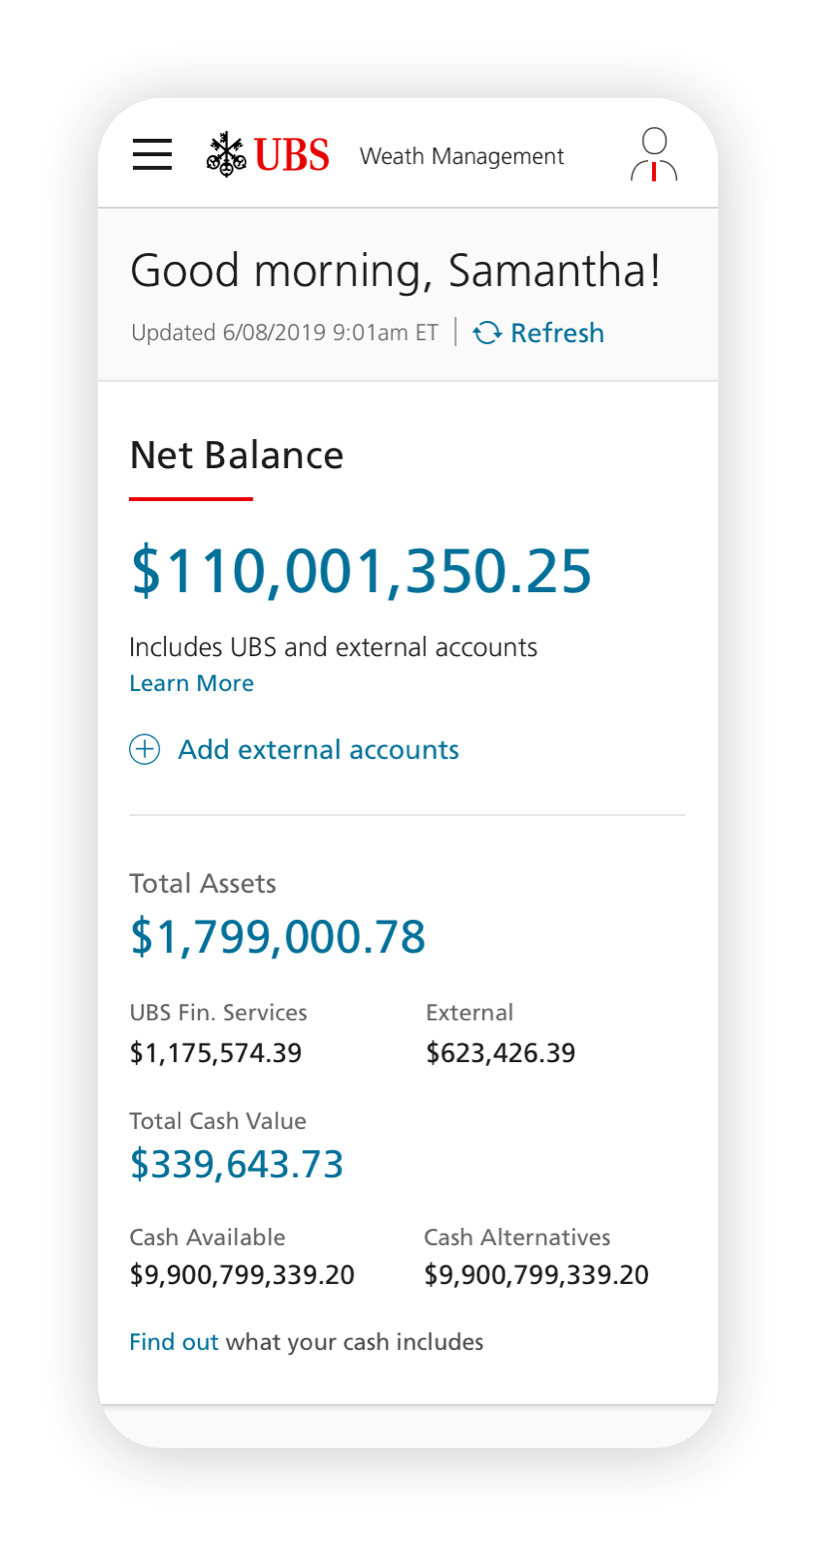
The new dashboard is tailored to meet individual client needs while providing an all-encompassing overview of their finances. The experience adapts to all devices and variations in content.
- Aligned to the spirit of previous app designs
- Initiated project with team Discovery sessions
- Strategized regularly with the client
- Guided by targeted in-person user testing each sprint
- Designed desktop first and three additional breakpoints
- Integrated new UI Patterns into the design system on approval
- Created full WCAG audit on completion
Challenges
- Complex data and constantly shifting requirements.
- A global brand with a design system in flux.
My Role
Alexis, the Lead UX Designer, worked on research, initial wires, and delved into the financial complexities. My role was UI and accessibility. The dashboard was tackled in five months of collaborative design sprints.
As the project progressed, UI/UX merged and overlapped. Alexis often helped with UI design and I iterated on the experience. While roles were morphed, she and the CD were always there to provide direction.
This project is distinct for me as it's one of the few times I've focused primarily on visuals and had the opportunity to work so in sync with other designers.
Deloitte Digital
Freelance Senior UI Designer
Creative Director
Lead UX Designer
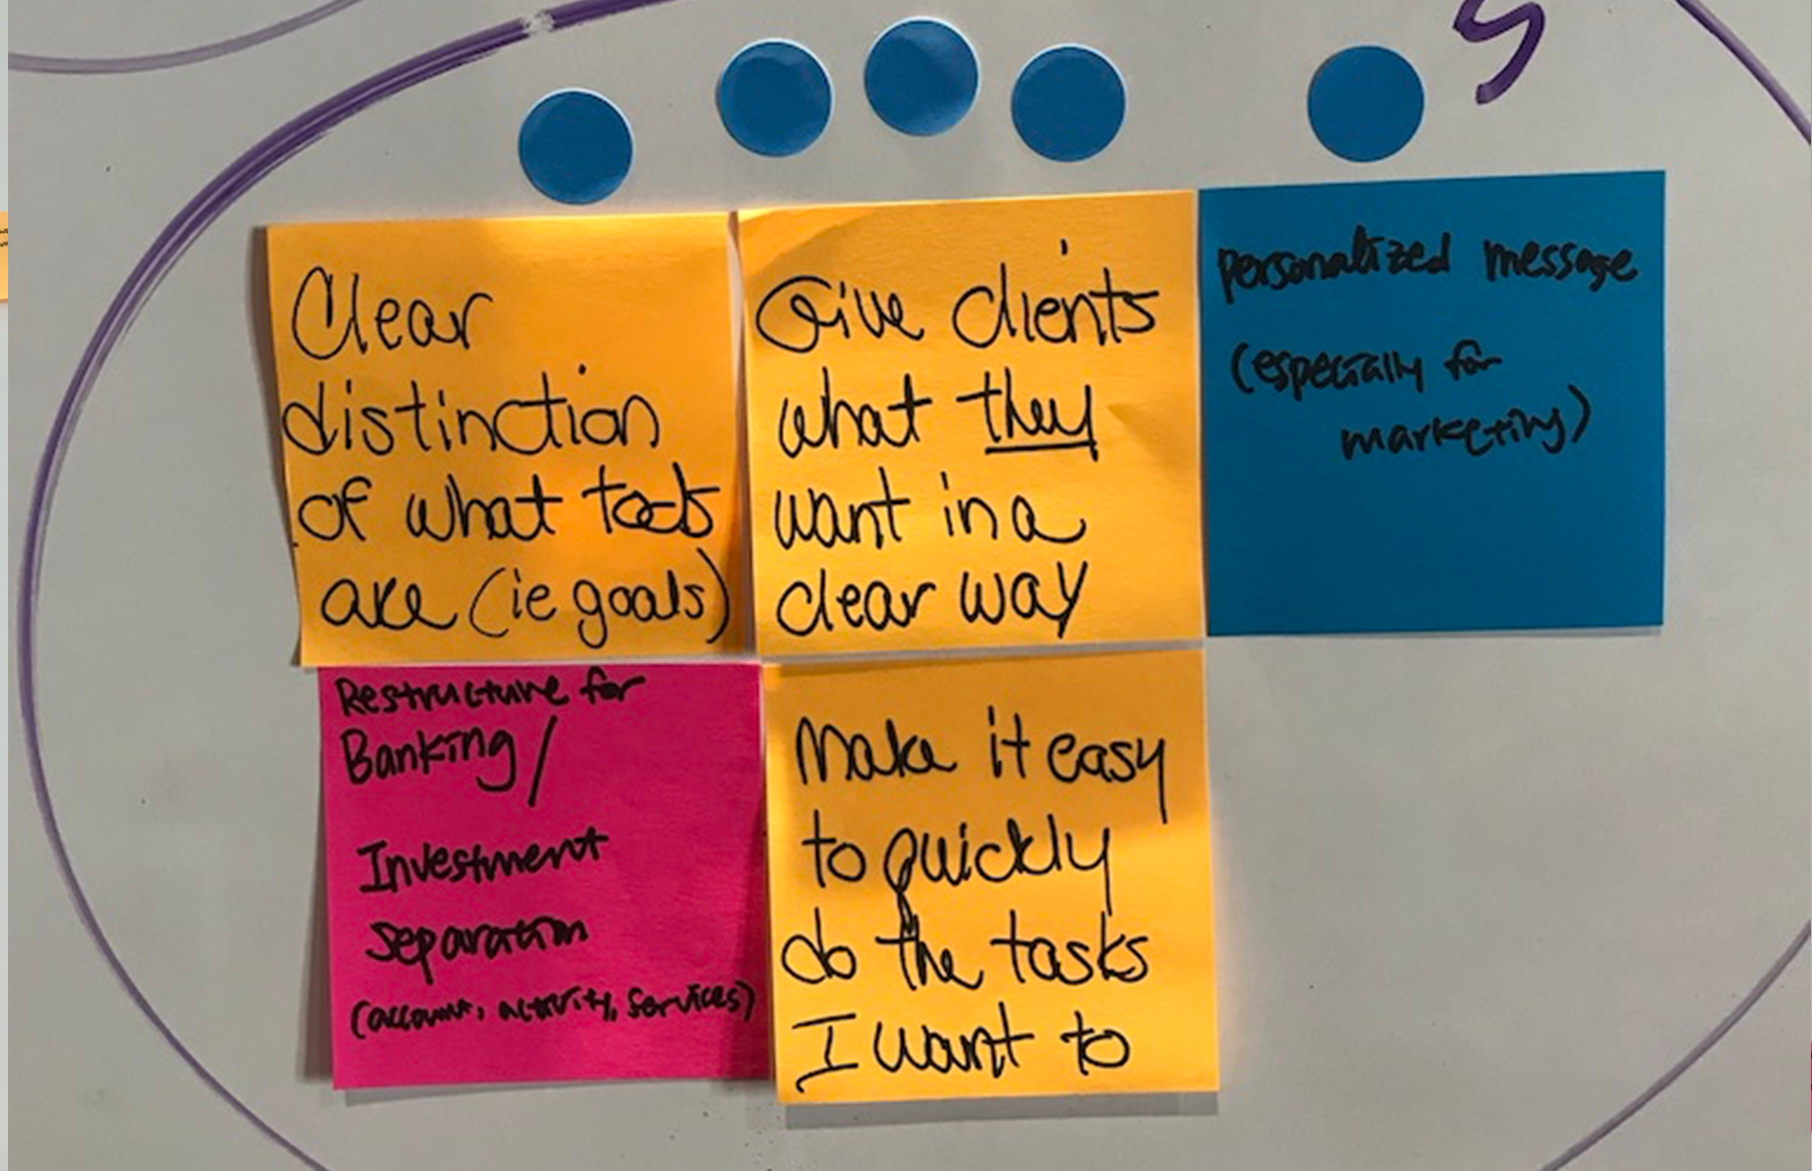
User research and client conversations allowed us to outline three critical areas of success:
customization, personalization,
& clarity
The new dashboard focuses on account data and limits promos. Ample spacing and a strong hierarchy helped readability.
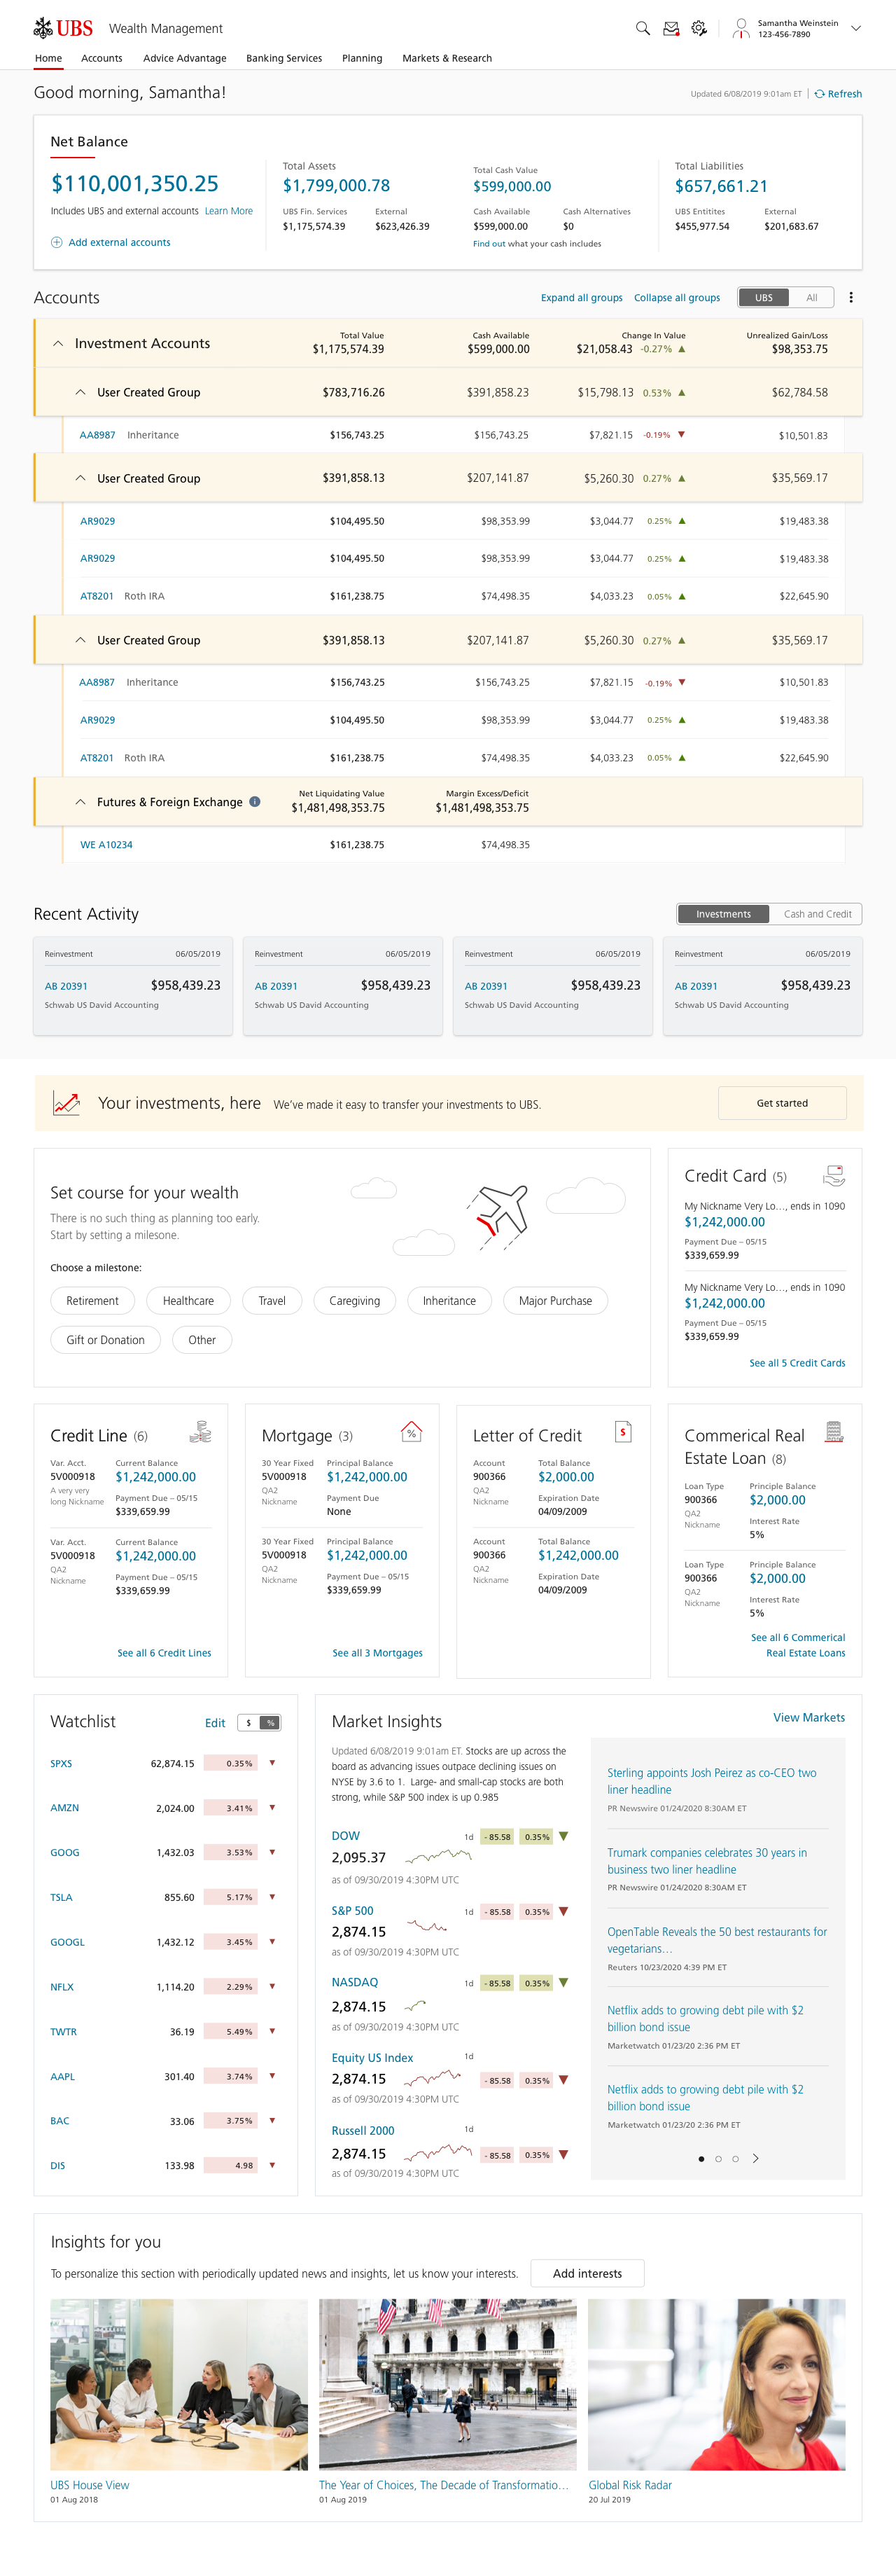
Dashboard Features
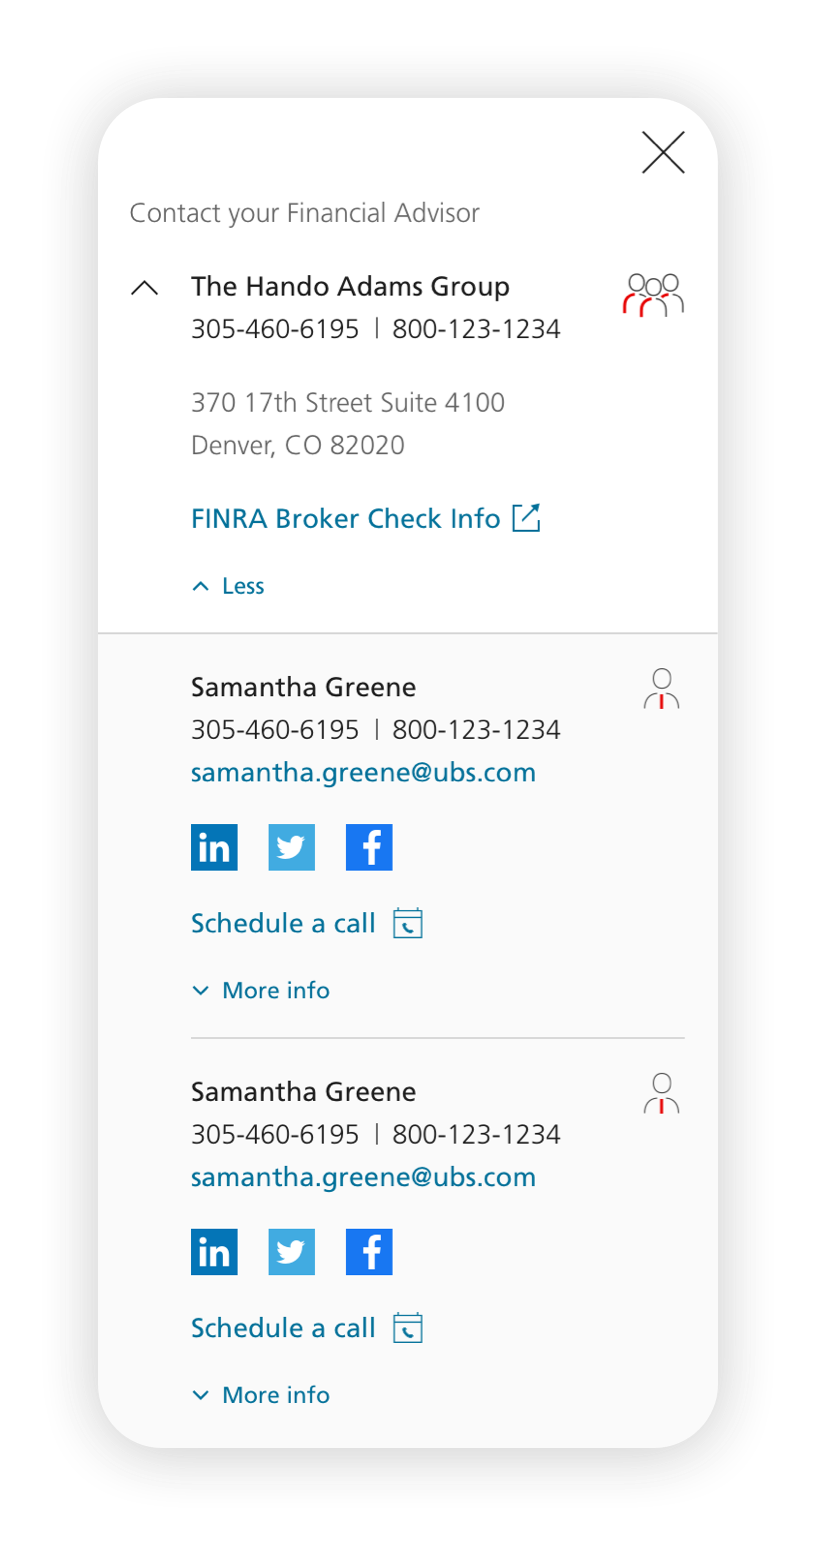
- Financial Advisors Communication
A direct connection to your personal advisor
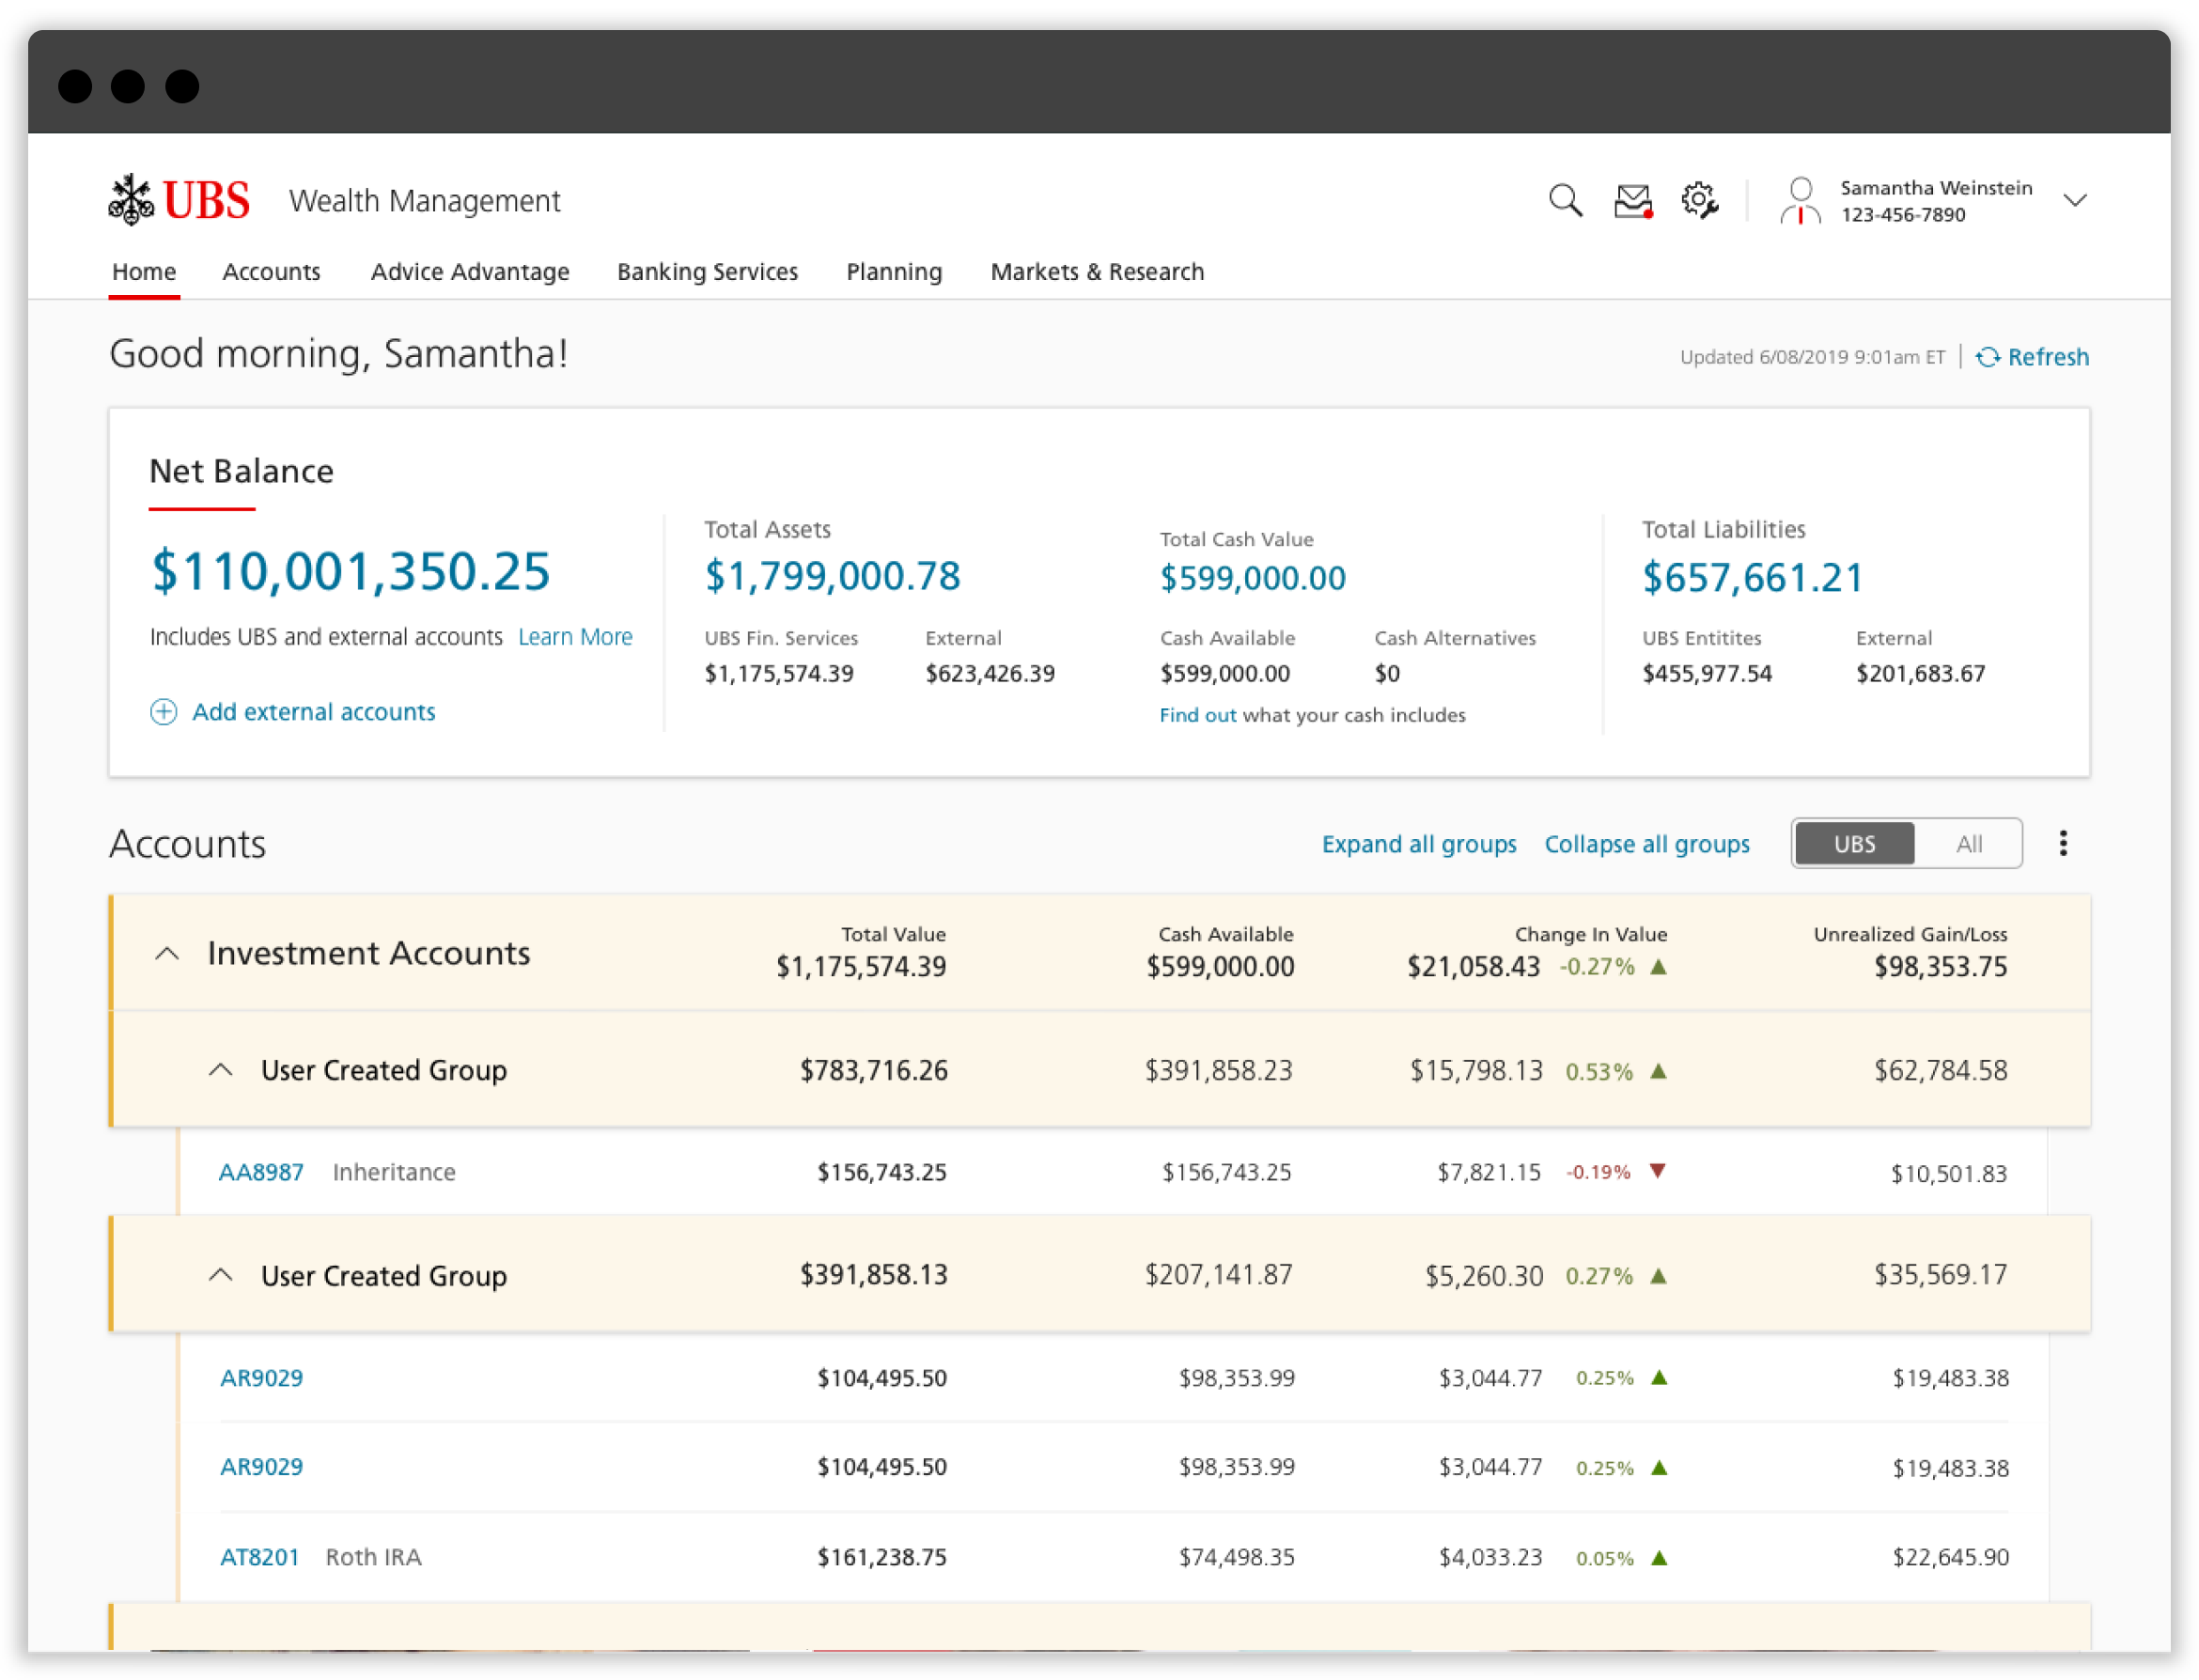
- Detailed Net Balances
Overview of current balances
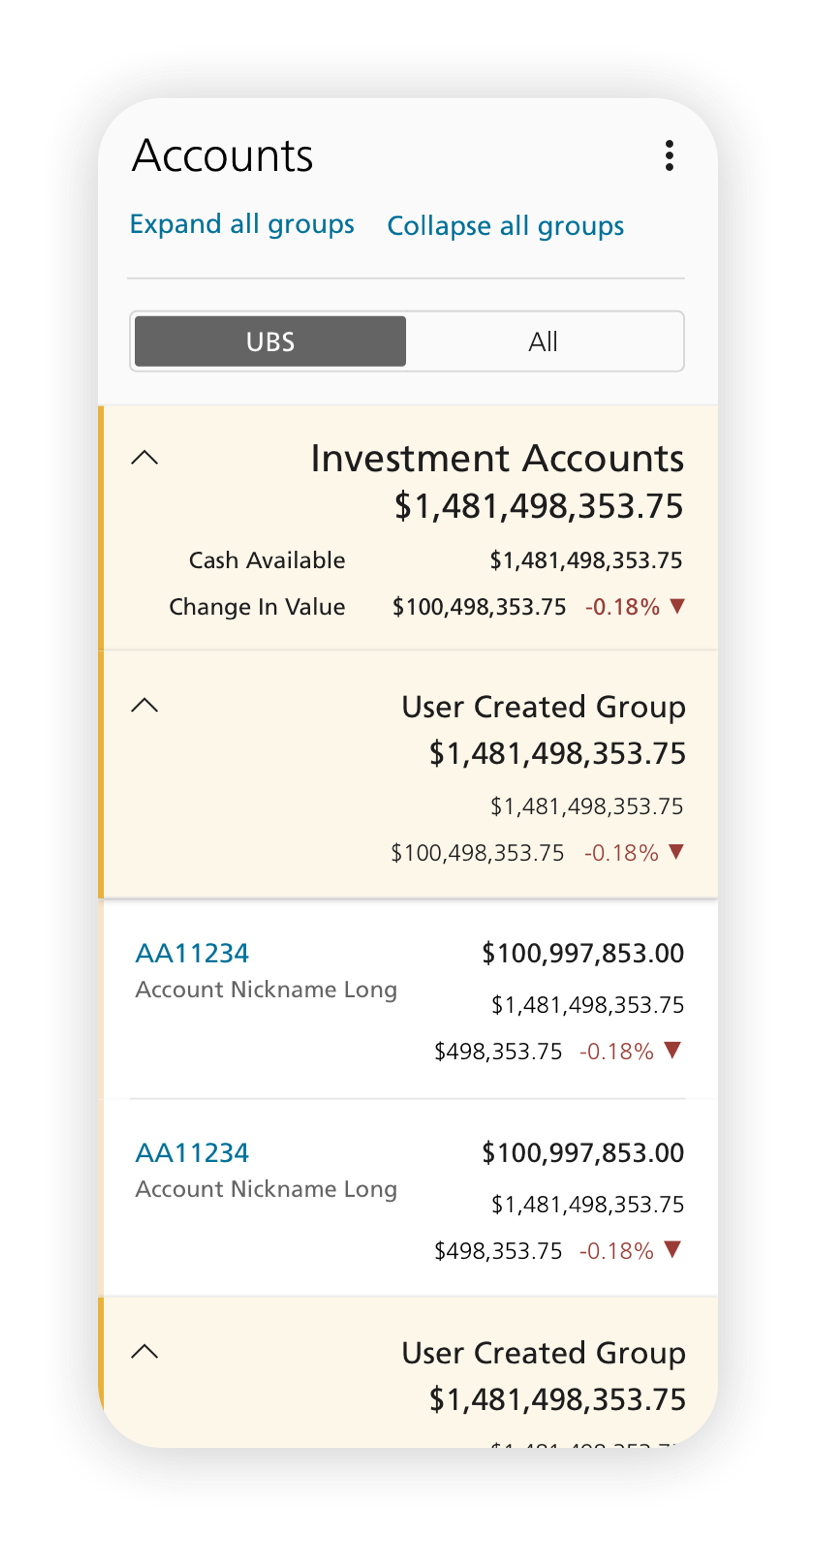
- Tiered Accounts Overview
Account details that you can drill into
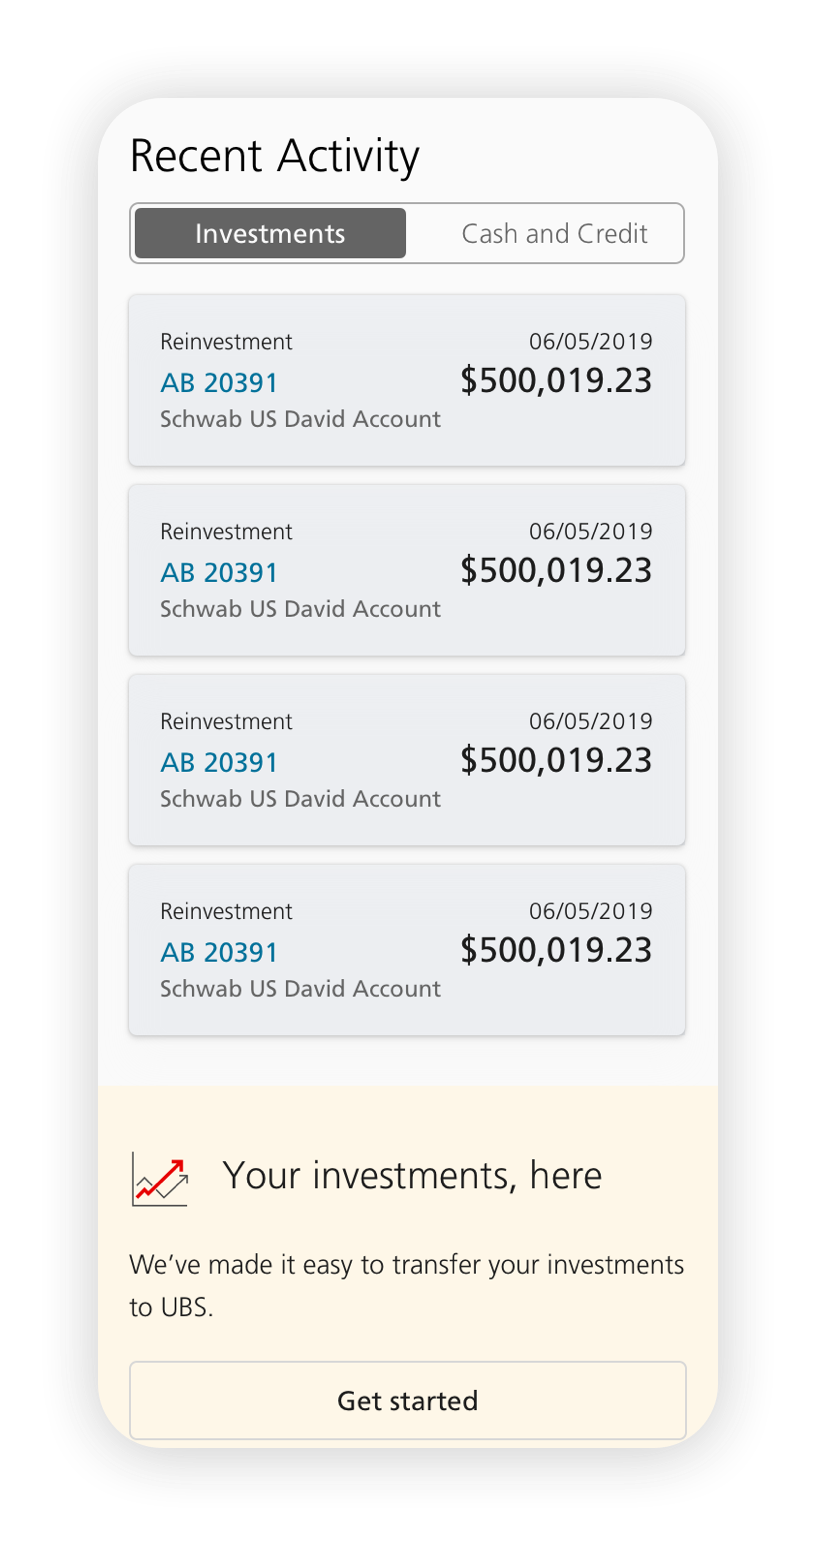
- Recent Activity
Individual transactions highlighted
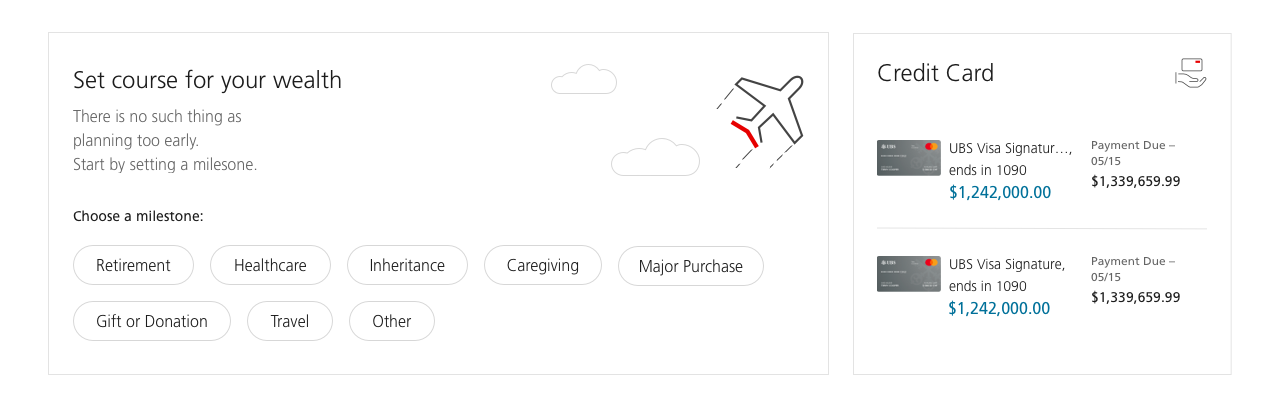
- Visual Milestones
Financial goals tool
- Personalized Activity Modules
Active loans, mortgages, and credit cards
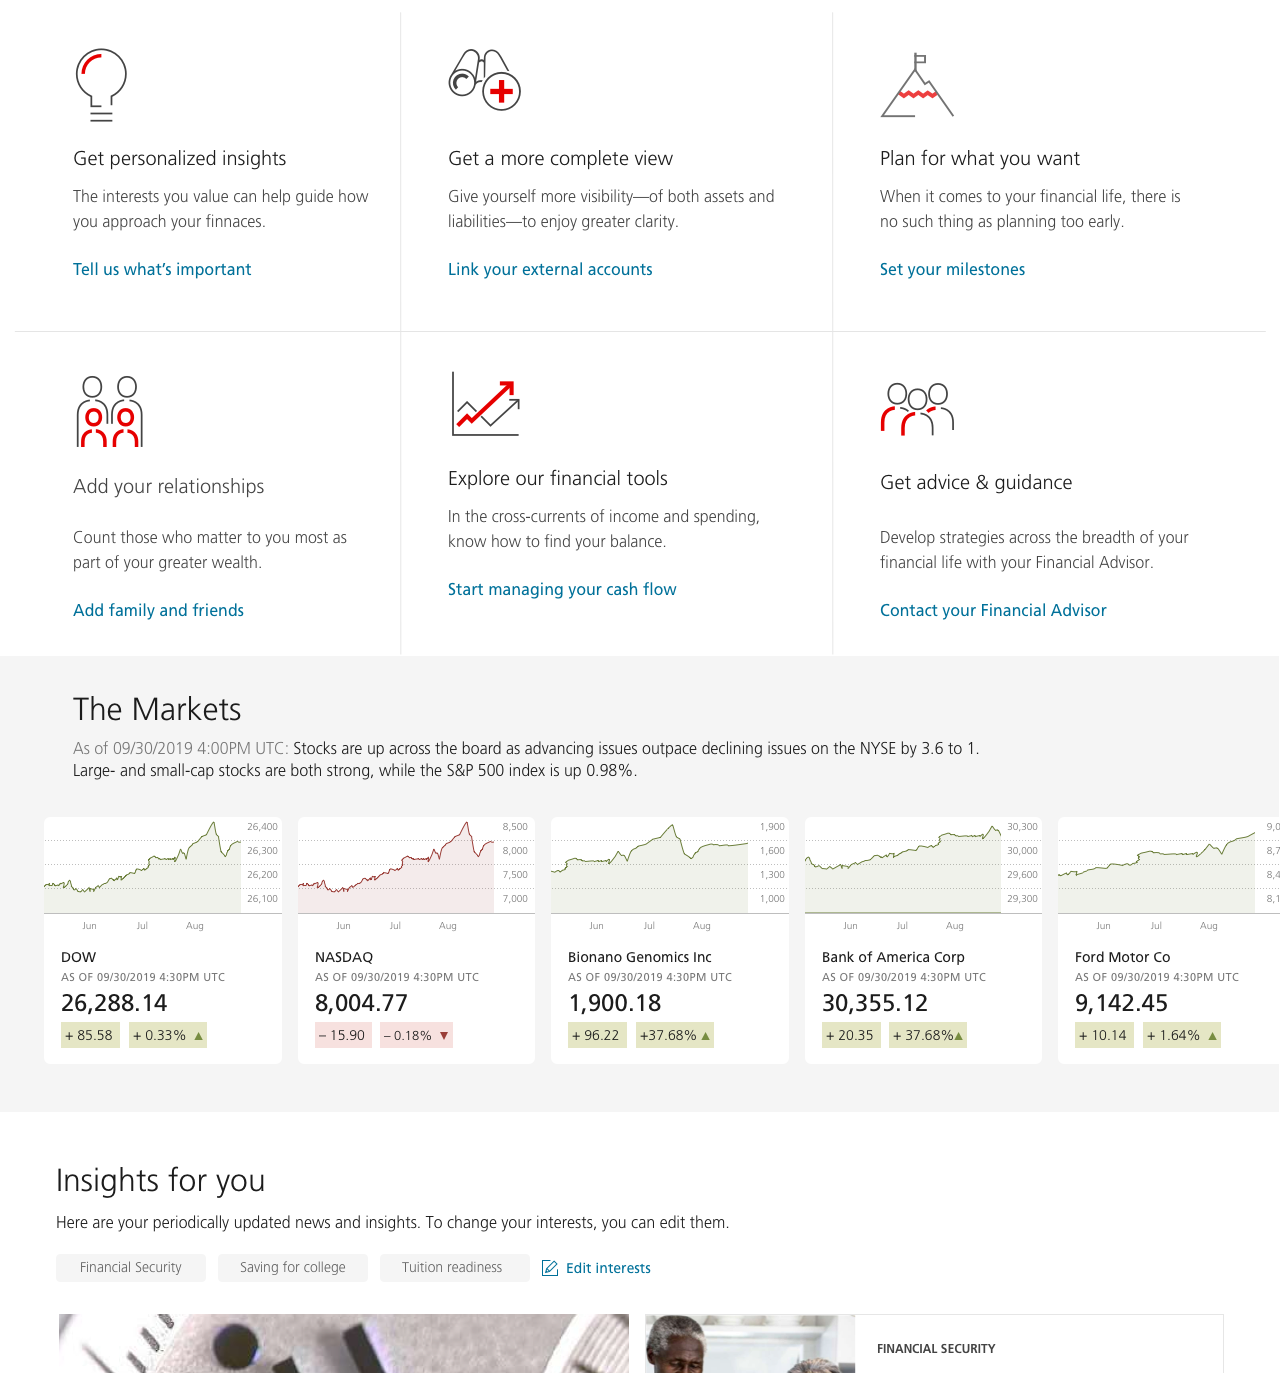
- Financial News and Markets
Daily content snapshots
- Promotional Ads
Limited ads that cycle through on load.
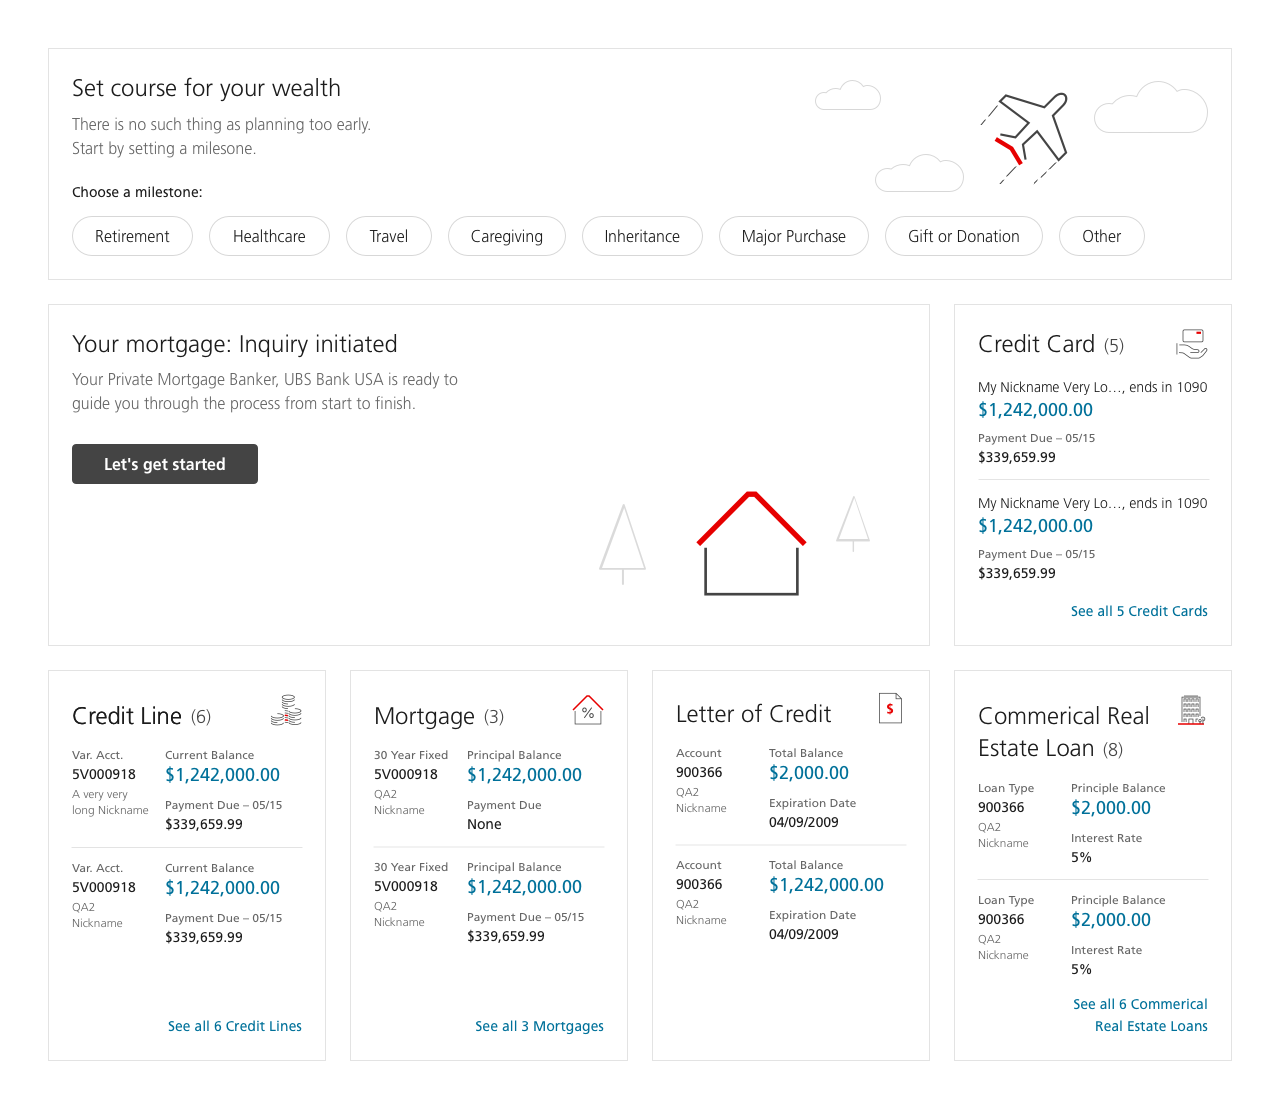
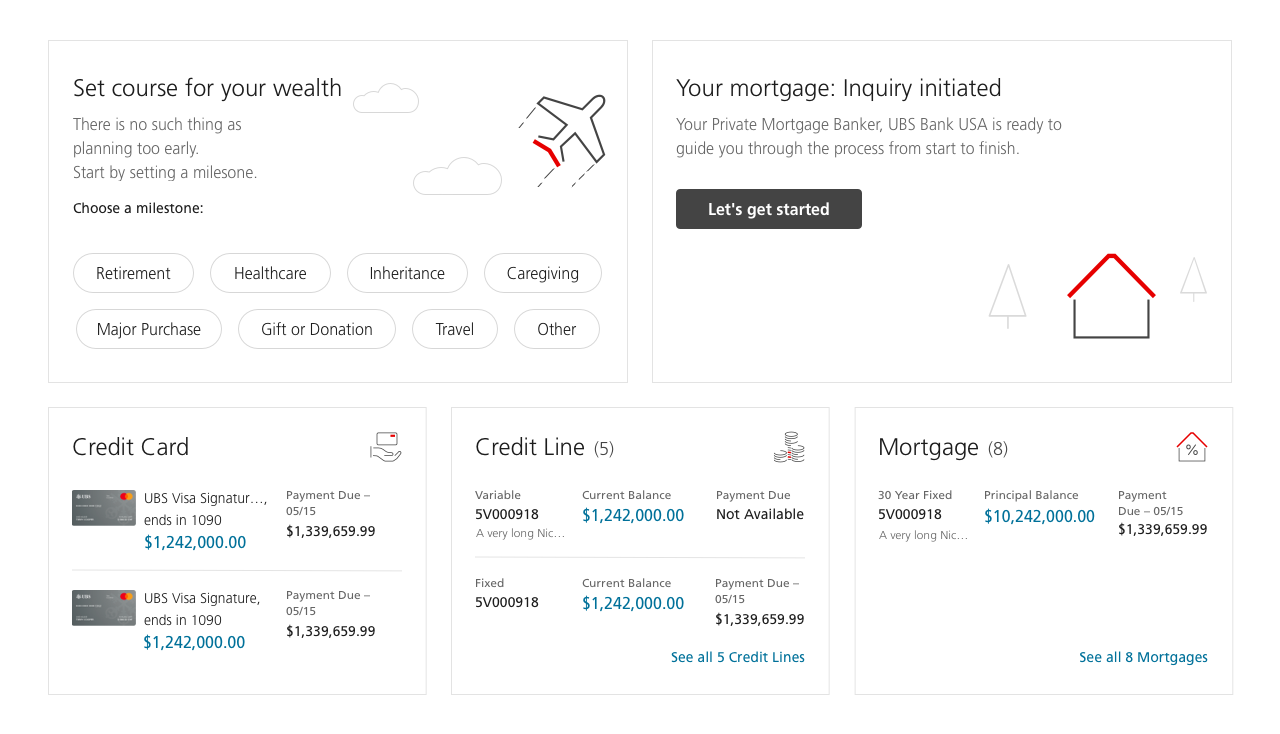
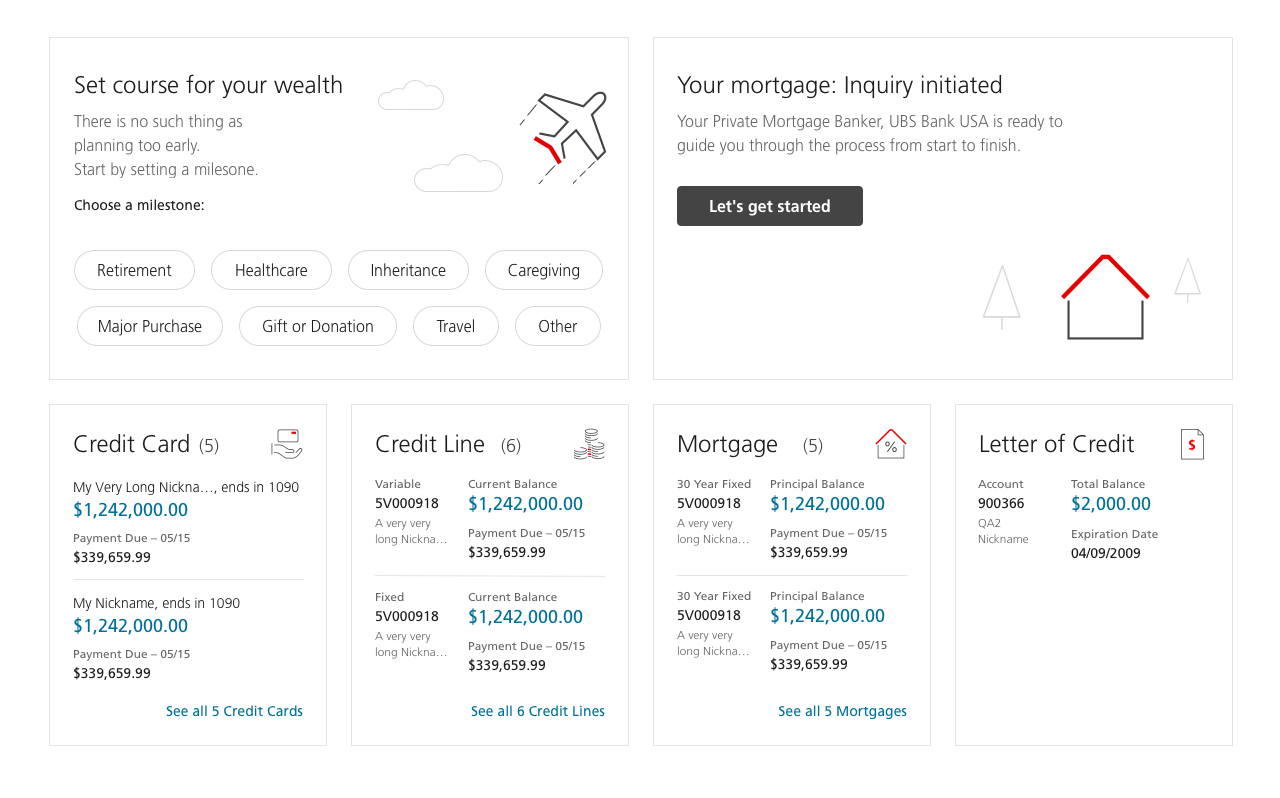
Dynamic modules highlight an individual's unique financial activity.
The included components follow a set of rules and scale to the grid:
- Milestones – A financial planning tool
- Mortgage Tracker
- Credit Card Balance
- Credit Line Balance
- Mortgage Balance
- Letter of Credit Overview
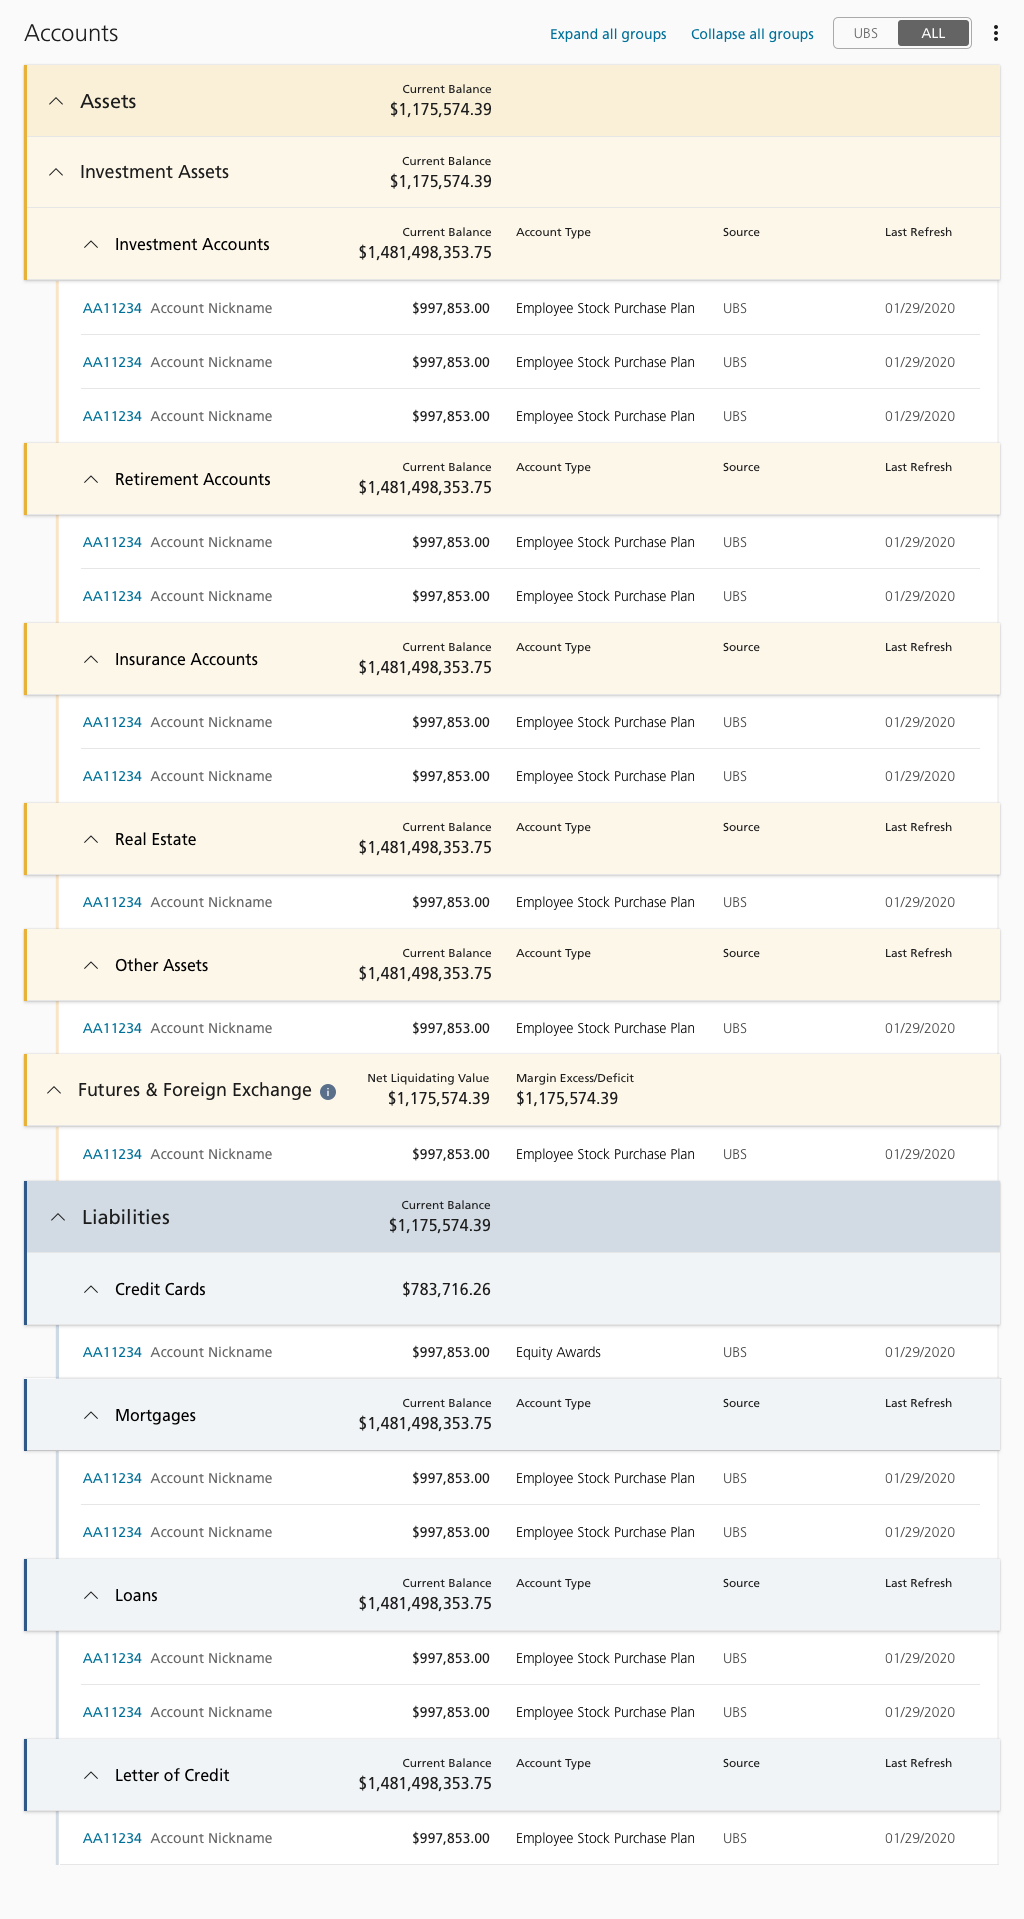
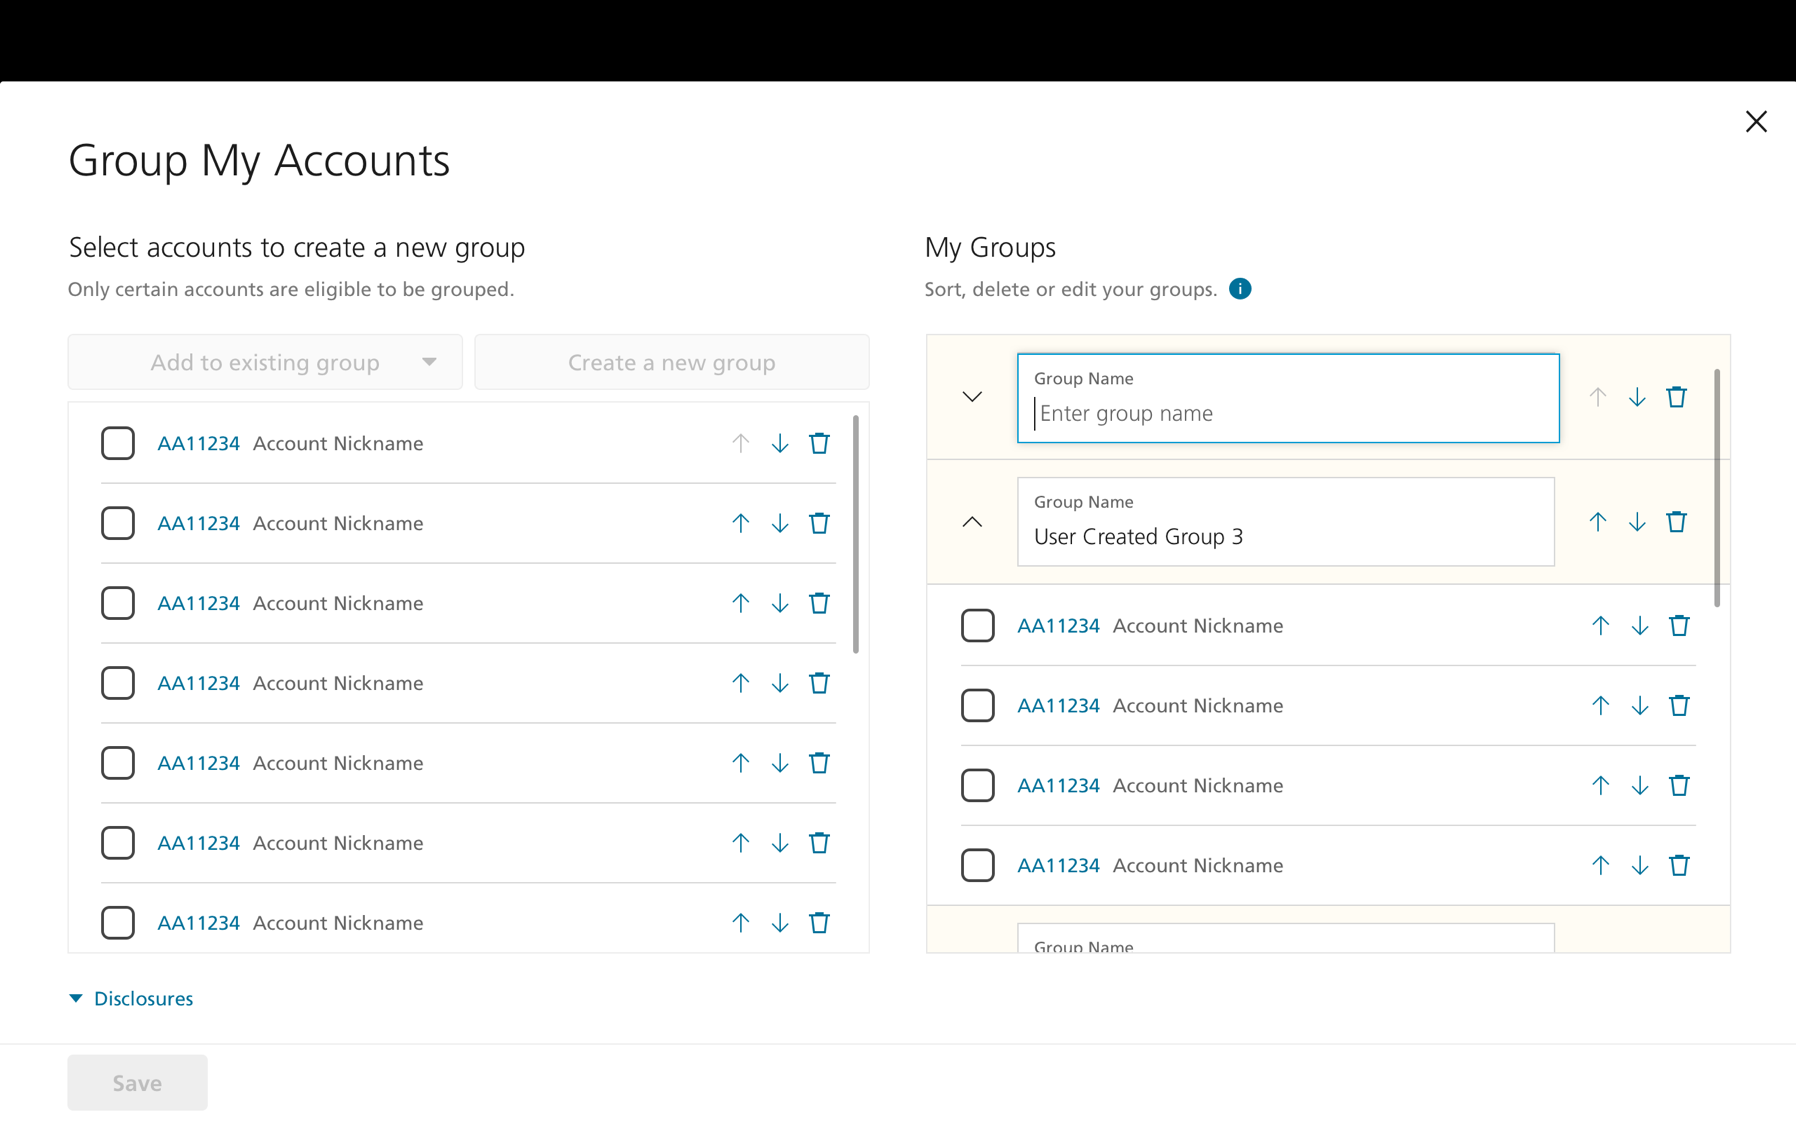
Customers can customize and group their accounts for convenience and clarity.
Surfacing high amounts of data clearly was the goal in the accounts section. I experimented with higher density designs, but this worked better. The accordion starts open, but when users can close sections manually, or collapse all at the top.
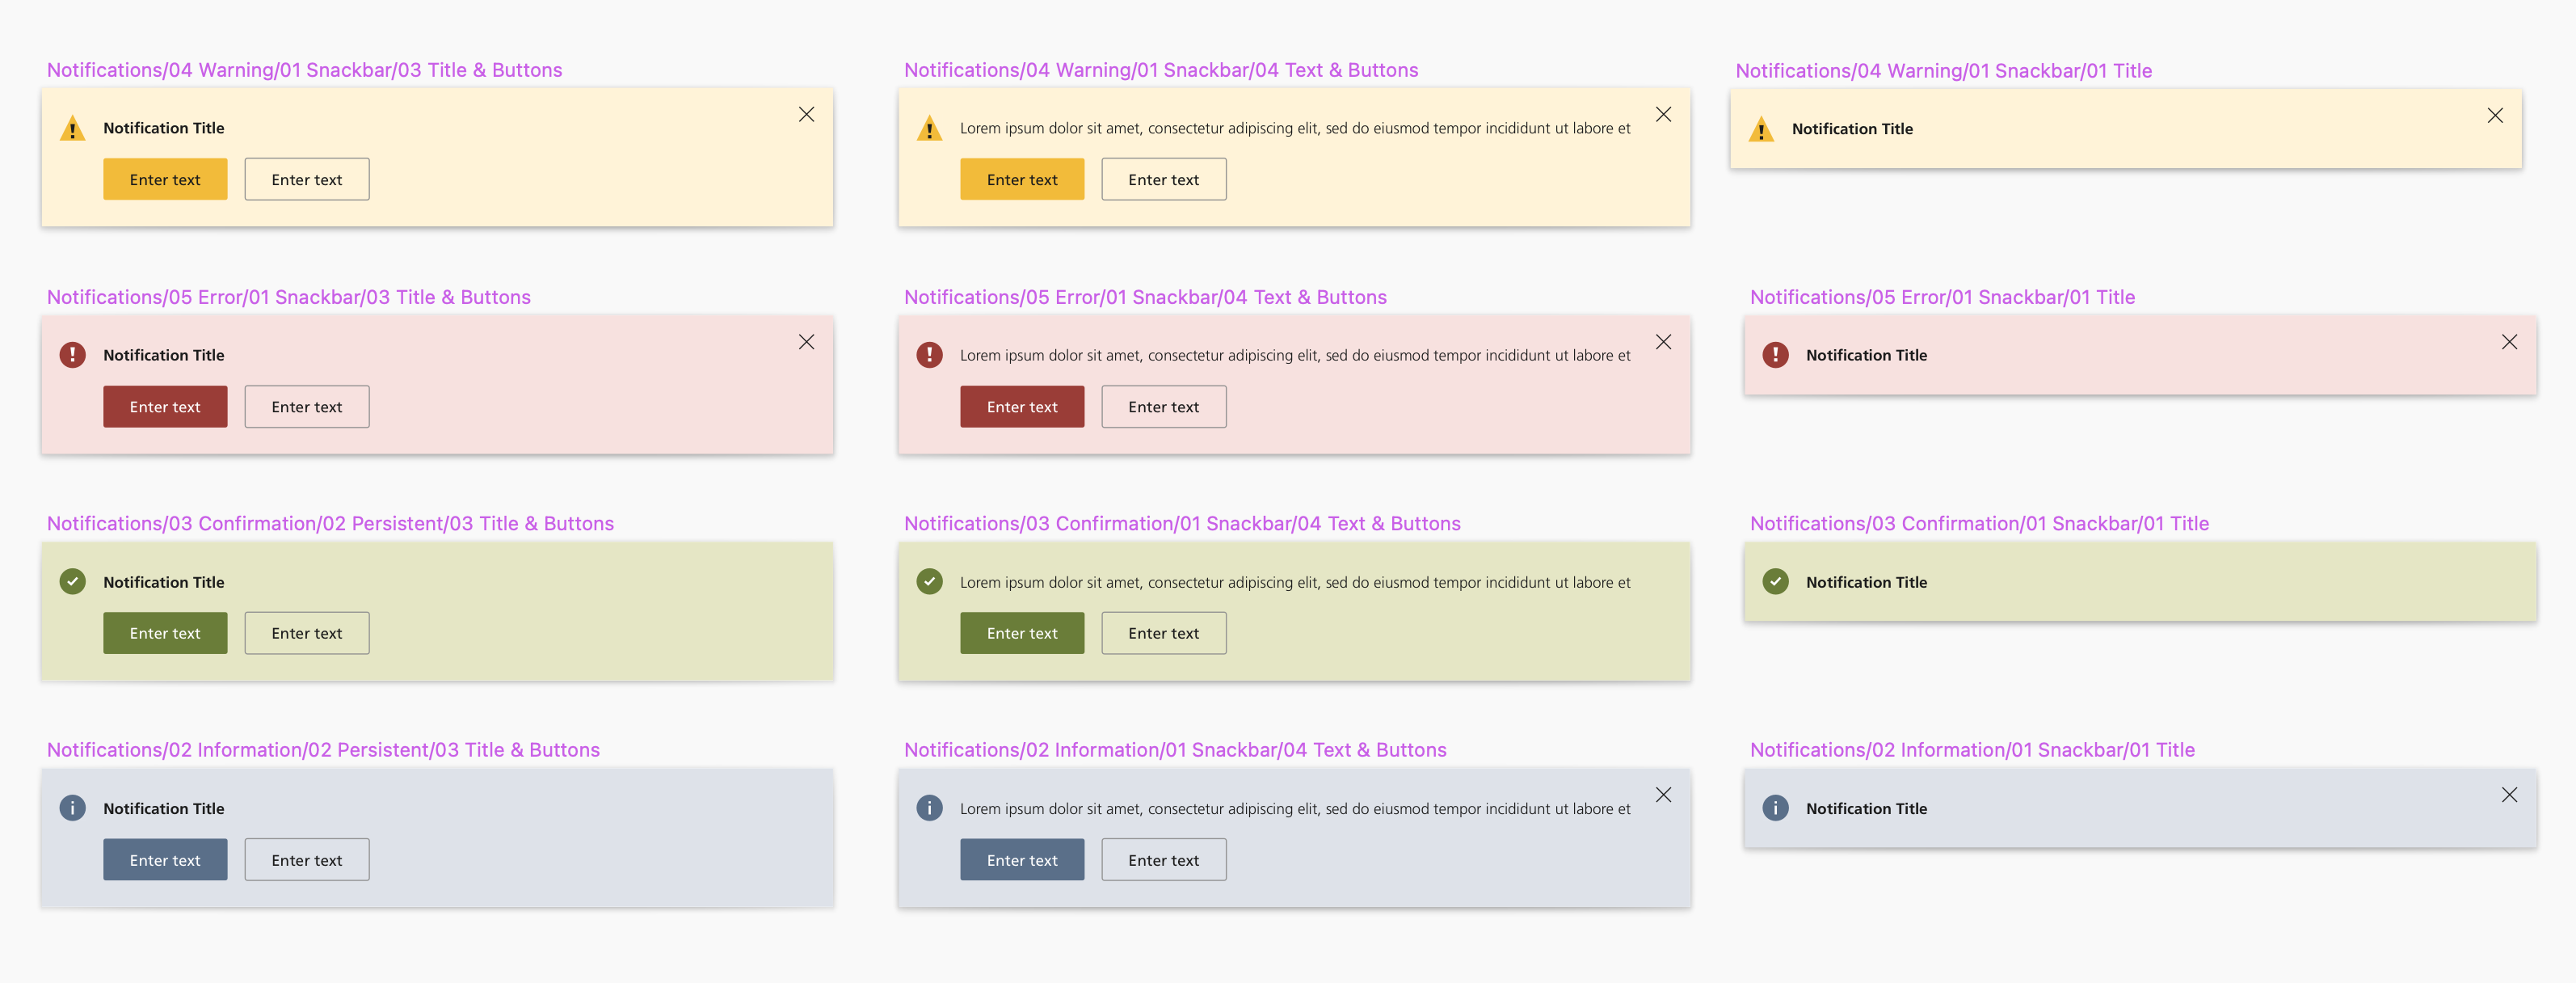
I incorporated established UI patterns when available and created new ones when needed.
Initial Research
Discovery
We started with stakeholder interviews and discovery meetings run by the Lead UX Designer. The goal was to better understand some of the pain points and areas to improve.
- The experience was too confusing and overwhelming.
- The site lacked the features users needed.
- The current dashboard didn't meet individual needs.
Visual Explorations
Using graphics and images to make the site feel more welcoming and accessible didn't test well. Users preferred a data-driven approach.
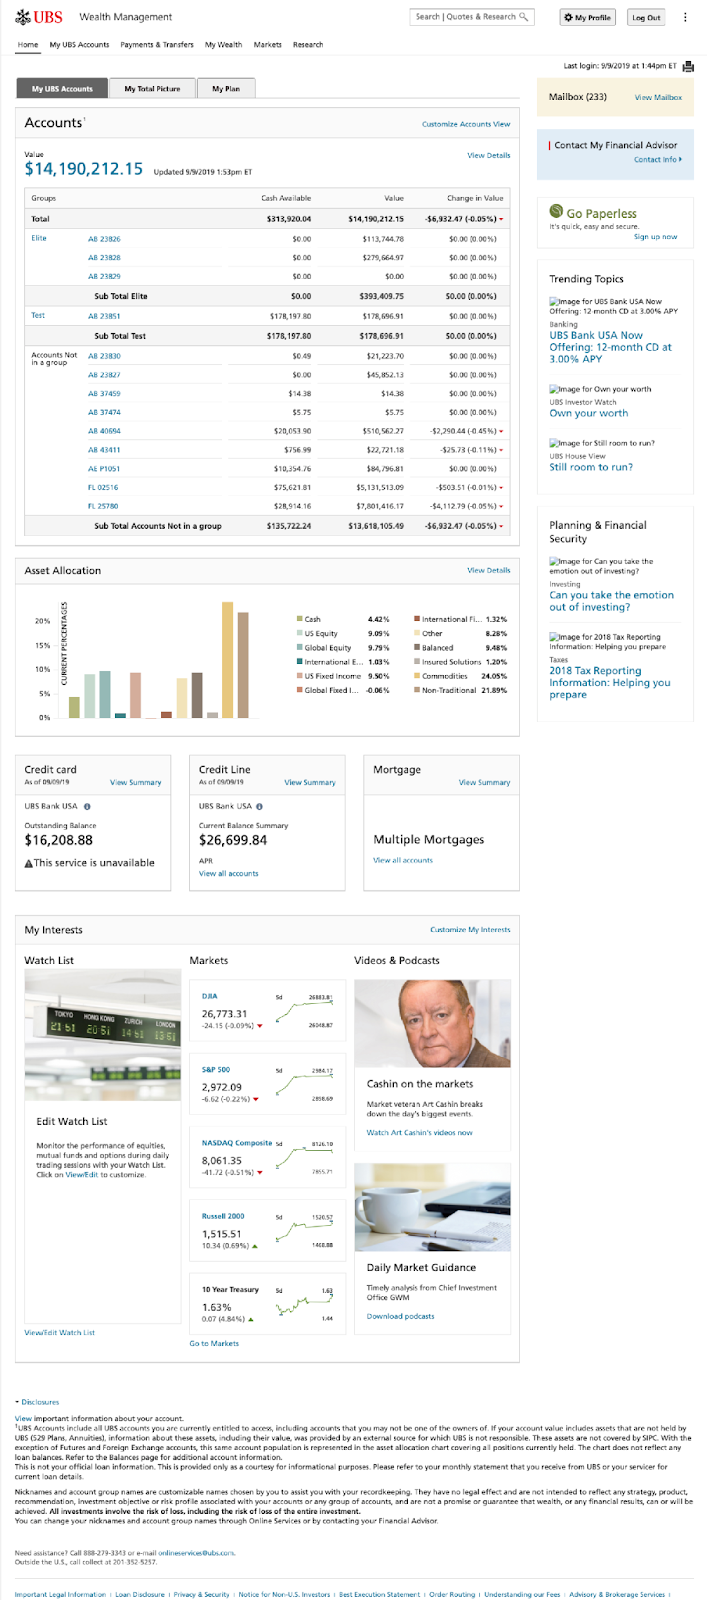
Previous Dashboard